Introduction
After you are done with BizTalk application development and unit testing, applications are tested for range of load(Load testing is not mandatory,it depends the business scenario),to see how application behaves and how it performs.For loadTesting we can use SOAPUI/LoadUI which would genarate variations of load at variant time.And to track the application behavior PerfMon is used.
This post is step by step reference for adding BizTalk performance counter in PerfMon to evaluate the performance and generate performance reports which can be shared across business team.
Below are the steps for setting up and scheduling BizTalk performance counters in PerfMon
Step 1: Create custom user defined Data Collector set
Give it a Name
Select what data you are interested in, for this I only want Performance Counters to be available
Step 2: Add the counters(which you want to monitor)
Select the DataCollector01 and click on Add button
As can be seen below, there are four counters available for BizTalkMessagingLatency category, you can either select particular counter or all of them and then click on Add button
There are more BizTalk related counters which you can select (for this post I have selected only one) refer : BizTalk Performance Counters and also included Processor counters
Step 3: Select the interval for which you want to collect data
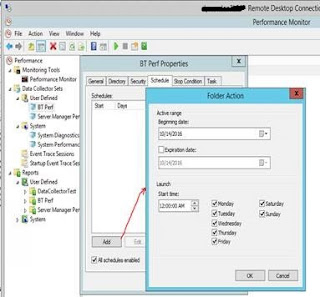
Step 4:This Data collector can be run manually and also can be scheduled
To schedule it right click on DataCollector you defined and go to properties->Schedule Tab and click on Add button
Set as per your requirement
As can be seen above Data collector is set to start at 12:00 AM but there is no stop time, to set stop time click on StopCondition Tab
Step 5: View the reports
To view the report, go to Reports and select the DataCollector which you created.
If you have questions or suggestions, feel free to do in comments section below !!!
Do share if you find this helpful .......
Knowledge Sharing is Caring !!!!!!
Tags:
BizTalk


